

By Our Insights Desk
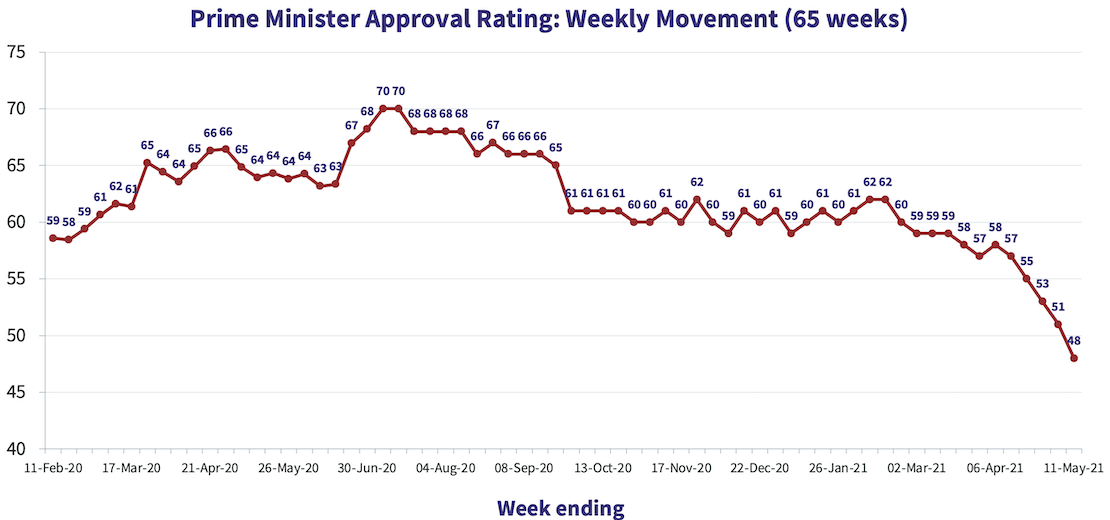
We started tracking Approval Ratings for the Prime Minister of India, and for Chief Ministers in several Indian states, in February 2020. Over the last two weeks, we have seen a significant interest in the weekly Prime Minister Approval Rating results we post on our social media feeds. Understandably, this interest is a result of the current COVID crisis in the country, which has seen a sharp dip in the PM’s Approval Rating over the last five weeks, as seen in the chart below.

In this post, we attempt to answer several queries that have been posed to us, both online and offline, related to our Approval Ratings product. If you have any other questions that are not covered below, please post them on our social media pages, and we will be happy to update this page with their answers.
How is this data collected?
We use Computer Assisted Telephonic Interviews (CATI) as the data collection methodology. The data collection is entirely telephonic, and no other form of research, such as online, social media, central location, intercepts or door-to-door, is used. The data is collected round the year on all working days (Mon-Sat).
What is the sample size?
Across 65 weeks of polling done so far, the average weekly sample size is 1,600. There can be variations in the weekly sample size, which ranges between 1,200-2,000.
What is the target group covered?
We cover respondents across more than 350 cities and towns across 22 states & Union territories in India, in the 18+ (voting eligible) age group, across both genders. Age and gender quotas for each state are decided based on the demographic data in Census 2011.
Is the poll based on a panel?
No, each week is a stand-alone research based on a standard weekly sample plan. No respondent is interviewed more than once in six months.
Why is rural India not covered?
Covering rural India telephonically is a challenge, especially in specific states in India. As we expand the scope of this product in the coming months and years, we will work on adding rural India to the target group too.
How is the Approval Rating calculated?
Each respondent is asked two proprietary questions: One for the PM and one for his/ her state’s CM. Based on the answers, respondents are classified into three categories, separately for PM & CM: Approve, Don't Approve & No Opinion.
The Ormax Approval Rating is defined as % Approve, divided by (% Approve + % Don’t Approve). For example, if 50% Approve, 40% Don't Approve and 10% have No Opinion, the Approval Rating will be 50/90% = 56%. Effectively, those with no opinion are not considered. Hence, an Approval Rating of, say, 48% means that 48% respondents (among those who had an opinion) approved, and 52% did not approve. The Ormax Approval Rating cannot take a negative value, unlike some other polls that use Approve minus Don't Approve as the reporting variable.
Census 2011 is used to assign weights to various states while calculating the PM Approval Rating, based on their urban adult population.
Where can I access these ratings?
We post weekly updates on PM Approval Rating every Thursday on our Twitter, Instagram and LinkedIn feeds. On the first Thursday of every month, updates on CM Approval Ratings for the previous month are posted, along with state-wise breakup of PM Approval Rating for the previous month.
Who is funding this product?
Our Approval Ratings project is entirely self-funded, with no affiliation to any other media or non-media outfit whatsoever. While the data (beyond that posted on social media) is available for subscription, we do not depend on any clients or mediahouses to keep this product up and running.
Can I use the data in media stories, blogs, research papers, opinion pieces, etc.?
Media firms and other interested organizations or individuals are free to use Approval Ratings data put up by Ormax Media in the public domain, e.g., on our social media pages, with prominent credit to Ormax Media. However, while using the data, no distortion of values or scales should be done in any way that can lead to misrepresentation.
Is additional data, e.g., gender, age or city-level analysis, available?
Additional analysis, beyond what’s in the public domain, is available for subscription. This includes analysis by age, gender and key cities, plus the possibility of adding customized questions to the poll. Note that we have chosen not to report Approval Ratings by religion, caste or other such social variables, and these cannot be accessed through subscription either.
Can these ratings be used to predict election outcomes?
We are too early in the lifecycle of this product to be able to predict election outcomes based on these ratings. As we build more data over the next few years, we may be able to create effective forecast models in pursuit of that objective.

Brand Lift measurement tool: Ormax Mpact
An overview of Ormax Mpact, a state-of-the-art Brand Lift Measurement tool designed to help marketers and advertisers evaluate the impact of their media campaigns, collaborations, and innovations

Certificate Program in Indian Media Business
All the details - curriculum, schedule, faculty, course fee, and more - about our Certificate Program in Indian Media Business, which will be conducted from Feb 22 to Mar 15, 2025
Subscribe to stay updated with our latest insights
We use cookies to improve your experience on this site. To find out more, read our Privacy Policy